Accelerated Algebra 2
Graphing Square Root Functions
Steps For Graphing Square Root Functions
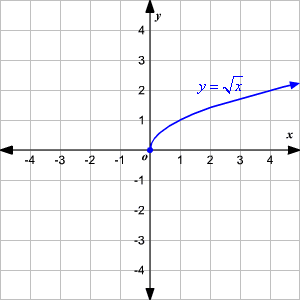
1. Become familiar with the shape of square root graphs and its parent function. The parent function is y equals the sqaure root of x. The graph of this function looks like this.
2. For your equation, create
a table of x and y values and
enter in a few points.
3. Plot these points on a
piece of graph paper, or on a
graph created by hand.
4. Connect these points
keeping in mind the general
shape of the parent function.
*Make sure to remember
the equation y=root a (x-h) +k.
Changing the values of these variables will result in different shifts in the graph. A change in h will move the graph left or right. A change in k will move the graph up or down. A change in a will dilate your graph.*
Video Example
still stuck? Here are some other great resources...
Purple Math
http://www.purplemath.com/modules/graphrad.htm
Youtube Example
https://www.youtube.com/watch?v=a0jviKGEUFQ

